pegainfer (4): From Pre-allocation to Graph Replay
In the previous post, we used toy kernels to quantify CUDA kernel launch overhead (~4-6μs per launch) and experimented with four approaches: CUDA Graph, Kernel Fusion, Mega Kernel, and Dynamic Parallelism. This post goes back to a real scenario — integrating CUDA Graph into the decode path of the Rust inference engine pegainfer (Qwen3-4B, BF16, RTX 5070 Ti) to see how much faster it actually gets and what pitfalls we hit.
Experiment environment: NVIDIA GeForce RTX 5070 Ti (16 GB), Driver 580.126.09, CUDA 13.0 Engine: pegainfer — pure Rust + CUDA inference engine, Qwen3-4B, BF16 full precision Code: https://github.com/xiaguan/pegainfer
Before: How Large Is the Decode Path’s Launch Overhead?
pegainfer’s decode path for Qwen3-4B runs about 400 CUDA kernels per token generated:
embedding
→ 36 × (rms_norm → Q gemv → K gemv → V gemv → fused_attention
        → O gemv → residual_add → rms_norm → fused_mlp(2 kernel)
        → residual_add)
→ final_rms_norm → lm_head gemv → argmax
Each Transformer layer has about 11 kernel launches. 36 layers makes 396, plus embedding, final norm, LM head, and argmax, totaling about 401.
Write a simple benchmark to profile. First warmup one round to heat up the GPU, then run 21 decode steps and time them.
fn bench_decode_steps() {
    let tokenizer = Tokenizer::from_file(MODEL_PATH).expect("load tokenizer");
    let model = Qwen3Model::from_safetensors(MODEL_PATH).expect("load model");

    let prompt = "Tell me a story";
    let prompt_tokens = tokenizer.encode(prompt).expect("encode");
    let mut rng = StdRng::seed_from_u64(42);
    let greedy = SamplingParams::default();  // temperature=0, greedy

    // Warmup: prefill + 5 decode steps
    let _ = model.generate(&prompt_tokens, 6, &greedy, &mut rng)?;

    // Bench: prefill + 20 decode steps
    let start = Instant::now();
    let tokens = model.generate(&prompt_tokens, 21, &greedy, &mut rng)?;
    let elapsed = start.elapsed();

    let decode_tokens = tokens.len() - prompt_tokens.len();
    let tpot = elapsed.as_secs_f64() * 1000.0 / decode_tokens as f64;
    eprintln!("{} decode tokens in {:?}, TPOT={:.2}ms ({:.1} tok/s)",
        decode_tokens, elapsed, tpot,
        decode_tokens as f64 / elapsed.as_secs_f64());
}
Wrap this benchmark with nsys:
nsys profile -o decode_trace --export sqlite -t cuda \
  ./target/release/deps/bench_decode-xxx bench_decode_steps --nocapture
Measured TPOT = 14.63ms (68.3 tok/s).
Use nsys’s sqlite export to extract kernel-level data for each decode step. Method: use the appearance of argmax_kernel as decode step boundaries — everything between two adjacent argmax calls is one decode step’s full set of kernels. Then we use duckdb (nothing special about it, just that duckdb-cli is more modern and convenient) for detailed performance analysis.
duckdb -c "
ATTACH 'decode_trace.sqlite' AS ns (TYPE sqlite, READ_ONLY);

WITH
-- 1. All GPU kernels, numbered by launch time
kernels AS (
  SELECT k.start, k.\"end\", s.value AS name,
         ROW_NUMBER() OVER (ORDER BY k.start) AS rn
  FROM ns.CUPTI_ACTIVITY_KIND_KERNEL k
  JOIN ns.StringIds s ON k.shortName = s.id
),

-- 2. argmax_kernel as decode step boundary markers
argmax AS (
  SELECT rn, ROW_NUMBER() OVER (ORDER BY rn) AS step_id
  FROM kernels WHERE name LIKE '%argmax%'
),

-- 3. Between two adjacent argmax = all kernels of one decode step
step_bounds AS (
  SELECT a1.step_id AS step, a1.rn AS start_rn, a2.rn AS end_rn
  FROM argmax a1 JOIN argmax a2 ON a2.step_id = a1.step_id + 1
),

-- 4. Per-step wall time / compute / gap (unit: μs)
step_metrics AS (
  SELECT sb.step, COUNT(*) AS kernels,
    (MAX(k.\"end\") - MIN(k.start)) / 1e3               AS wall_us,
    SUM(k.\"end\" - k.start) / 1e3                       AS compute_us,
    (MAX(k.\"end\") - MIN(k.start) - SUM(k.\"end\" - k.start)) / 1e3 AS gap_us
  FROM step_bounds sb
  JOIN kernels k ON k.rn BETWEEN sb.start_rn AND sb.end_rn
  GROUP BY sb.step
),

-- 5. Filter: remove first step (one-time overhead) and steps with abnormal kernel count (prefill/bench boundary aliasing)
stable AS (
  SELECT * FROM step_metrics WHERE kernels = 401 AND step > 1
)

SELECT count(*) AS n,
  round(median(wall_us), 0)                   AS wall_med,
  round(median(compute_us), 0)                AS comp_med,
  round(median(gap_us), 0)                    AS gap_med,
  round(median(100.0 * gap_us / wall_us), 1)  AS gap_pct
FROM stable;
"
Result:
┌───────┬──────────┬──────────┬─────────┬─────────┐
│   n   │ wall_med │ comp_med │ gap_med │ gap_pct │
│ int64 │  double  │  double  │ double  │ double  │
├───────┼──────────┼──────────┼─────────┼─────────┤
│  24   │ 13495.0  │ 11919.0  │ 1538.0  │  11.4   │
└───────┴──────────┴──────────┴─────────┴─────────┘
24 steady-state decode steps, single-step wall time median 13,495μs, of which pure kernel execution 11,919μs, inter-kernel gap 1,538μs — gap accounts for 11.4%. That means each decode step spends over 1.5ms on gaps between kernels.
Why only 24 steps? The benchmark structure is warmup generate (6 steps) + bench generate (21 steps), 27 argmax calls total, cutting out 26 steps. The SQL filters out two abnormal steps:
| step | kernels | wall (μs) | gap% | Exclusion reason |
|---|---|---|---|---|
| 1 | 401 | 16,466 | 28.4% | First step one-time overhead (see below) |
| 6 | 1,158 | 33,007 | 61.1% | Warmup/bench boundary aliasing (see below) |
Why is step 1’s gap as high as 28.4%? This is the entire process’s first decode step (warmup’s first decode step). Compare the inter-kernel gap distribution of step 1 vs a steady-state step (step 2):
| Metric | Step 1 | Step 2 (steady-state) |
|---|---|---|
| gap > 100μs count | 5 | 0 |
| gap > 50μs count | 7 | 1 |
| Max gap | 1,939μs | 69μs |
| Total gap | 4,670μs | 1,558μs |
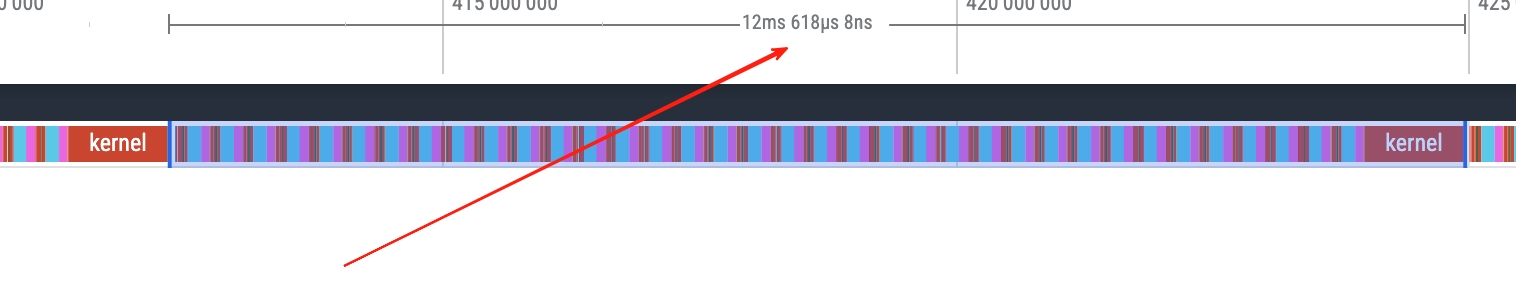
The largest gaps in step 1 all appear at rms_norm_kernel → fused_mlp_intermediate_kernel transitions (1,939 / 267 / 212 μs), while the same transitions in step 2 are only ~21μs. These kernels are being called for the first time in the decode path, and the driver/runtime has first-launch initialization overhead. Excluded.
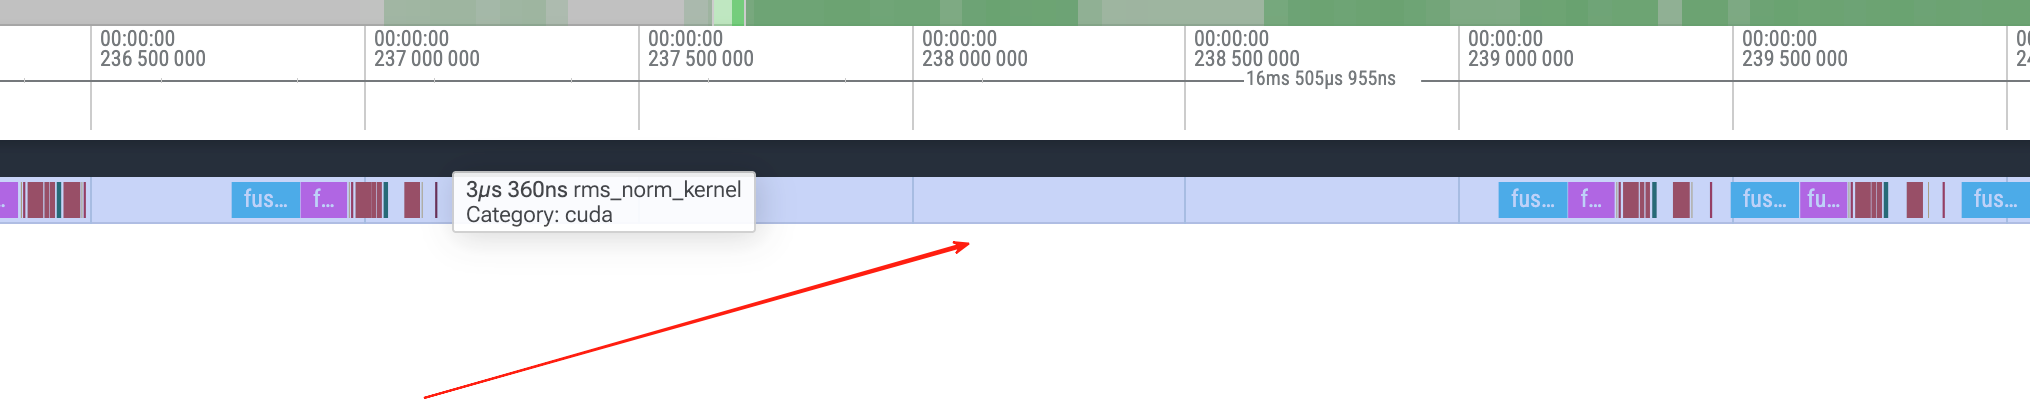
There’s a large blank area between the rms kernel and fused mlp kernel.
Step 6 spans the warmup’s last step (argmax 6) and the bench’s first step (argmax 7), including the entire prefill of bench generate, so the kernel count jumps to 1,158.
Steady-state decode step kernel time distribution (same batch of 24 steps):
duckdb -c "
ATTACH 'decode_trace.sqlite' AS ns (TYPE sqlite, READ_ONLY);

WITH
-- 1-3: same as above, build kernel numbering → argmax boundaries → step ranges
kernels AS (
  SELECT k.start, k.\"end\", s.value AS name,
         ROW_NUMBER() OVER (ORDER BY k.start) AS rn
  FROM ns.CUPTI_ACTIVITY_KIND_KERNEL k
  JOIN ns.StringIds s ON k.shortName = s.id
),
argmax AS (
  SELECT rn, ROW_NUMBER() OVER (ORDER BY rn) AS step_id
  FROM kernels WHERE name LIKE '%argmax%'
),
step_bounds AS (
  SELECT a1.step_id AS step, a1.rn AS start_rn, a2.rn AS end_rn
  FROM argmax a1 JOIN argmax a2 ON a2.step_id = a1.step_id + 1
),

-- 4. Filter steady-state steps (kernels=401 and not first step)
stable_steps AS (
  SELECT sb.* FROM step_bounds sb
  JOIN kernels k ON k.rn BETWEEN sb.start_rn AND sb.end_rn
  GROUP BY sb.step, sb.start_rn, sb.end_rn
  HAVING COUNT(*) = 401 AND sb.step > 1
),

-- 5. Expand each kernel within steady-state steps
stable_kernels AS (
  SELECT k.name, (k.\"end\" - k.start) AS dur_ns
  FROM stable_steps ss
  JOIN kernels k ON k.rn BETWEEN ss.start_rn AND ss.end_rn
),

totals AS (SELECT SUM(dur_ns) AS total_ns FROM stable_kernels)

-- 6. Aggregate by kernel name: percentage, average time, count per step
SELECT name,
  round(100.0 * SUM(dur_ns) / (SELECT total_ns FROM totals), 1)              AS pct,
  round(AVG(dur_ns) / 1e3, 1)                                                AS avg_us,
  round(COUNT(*) * 1.0 / (SELECT COUNT(DISTINCT step) FROM stable_steps), 0) AS per_step
FROM stable_kernels
GROUP BY name
ORDER BY SUM(dur_ns) DESC;
"
┌─────────────────────────────────────────┬────────┬────────┬──────────┐
│ name │ pct │ avg_us │ per_step │
├─────────────────────────────────────────┼────────┼────────┼──────────┤
│ fused_mlp_intermediate_kernel │ 37.5 │ 124.5 │ 36.0 │
│ kernel (cuBLAS GEMV) │ 30.3 │ 24.9 │ 145.0 │
│ fused_mlp_output_kernel │ 25.6 │ 84.9 │ 36.0 │
│ fused_gqa_attention_single_token_kernel │ 3.7 │ 12.4 │ 36.0 │
│ rms_norm_kernel │ 2.1 │ 3.4 │ 73.0 │
│ add_kernel │ 0.6 │ 0.9 │ 72.0 │
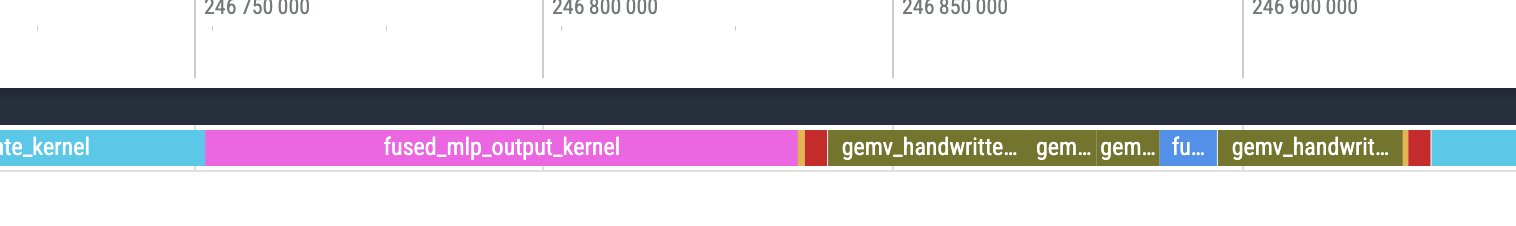
└─────────────────────────────────────────┴────────┴────────┴──────────┘MLP takes 63% of compute time (intermediate 37.5% + output 25.6%), GEMV takes 30%. The entire decode step is almost entirely bandwidth-bound GEMV and elementwise operations.
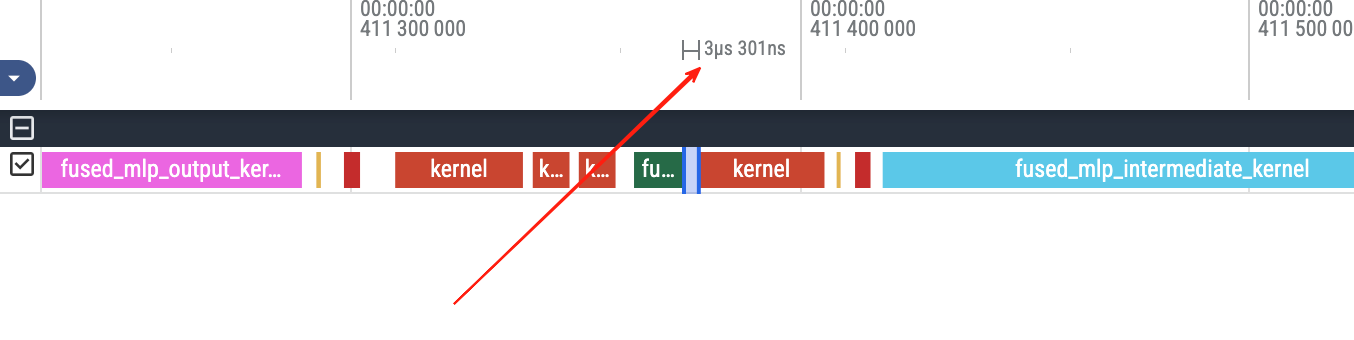 The GPU timeline has many visible gaps, each roughly within 5us. We use duckdb to further break down this statistic.
Kernel gap distribution:
┌─────────┬───────┬────────┐
│  range  │  cnt  │  pct   │
├─────────┼───────┼────────┤
│ <1us    │   476 │    5.0 │
│ 1-5us   │  7089 │   73.8 │
│ 5-10us  │  1838 │   19.1 │
│ 10-50us │   169 │    1.8 │
│ >50us   │    28 │    0.3 │
└─────────┴───────┴────────┘
The vast majority of gaps are 1-5μs, but it’s also worth noting there are long-tail gaps exceeding 50us.
TPOT observed from the trace is about 13.3ms (there may be screenshot inaccuracy).
Theoretically, pure kernel computation only needs ~12ms (comp_med = 11,919μs above), but the benchmark measured TPOT ~14.6ms. The extra ~2.5ms is eaten by inter-kernel launch gaps, cudaMallocAsync/cudaFreeAsync, and CPU sync.
How large is the memory allocation overhead? Check CUDA runtime API call statistics:
duckdb -c "
ATTACH 'decode_trace.sqlite' AS ns (TYPE sqlite, READ_ONLY);
SELECT s.value AS name, count(*) AS calls,
  round(avg(r.\"end\" - r.start) / 1e3, 1) AS avg_us
FROM ns.CUPTI_ACTIVITY_KIND_RUNTIME r
JOIN ns.StringIds s ON r.nameId = s.id
WHERE s.value LIKE '%Alloc%' OR s.value LIKE '%Free%'
GROUP BY s.value ORDER BY calls DESC;
"
┌──────────────────────┬───────┬────────┐
│ name │ calls │ avg_us │
├──────────────────────┼───────┼────────┤
│ cuMemAllocAsync │ 19934 │ 5.4 │
│ cuMemFreeAsync │ 19934 │ 2.2 │
└──────────────────────┴───────┴────────┘cuMemAllocAsync was called 19,934 times, cuMemFreeAsync also 19,934 times — almost every operator at every step is doing malloc + free. On average each alloc takes 5.4μs, free takes 2.2μs. Added up, it’s quite significant.
Just Slap on CUDA Graph? Not That Simple
In the previous post, using CUDA Graph only needed three steps: BeginCapture → submit kernels → EndCapture + GraphLaunch. But doing this directly on pegainfer’s decode path runs into a series of problems.
Obstacle 1: Temporary Buffers Inside Operators
fused_mlp internally does cudaMallocAsync to allocate an intermediate activation buffer. Similarly, it will crash during capture.
Obstacle 2: Scalar Parameters Get Frozen
CUDA Graph recording freezes all kernel launch parameter values. But three scalars must change every decode step:
token_id— the current token to embedcurrent_pos— the write position in KV cacheseq_len— the current attention window length
If these are passed to kernels as scalars (like embedding_kernel<<<...>>>(embed, token_id, out, hidden_size)), graph replay will always use the values from recording time.
Obstacle 3: RoPE Cache Pointer Changes
The original implementation fetches a per-position slice of RoPE cos/sin (cos_cache[pos]) each step, and the returned view pointer is different each step. Pointers are also kernel parameters and will be frozen.
Obstacle 4: Rust CUDA Binding’s Event Tracking
This pitfall is rather hidden and worth explaining in detail.
cudarc’s CudaSlice<T> is not just ptr + len. It also maintains a pair of CUDA events:
pub struct CudaSlice<T> {
    cu_device_ptr: CUdeviceptr,
    len: usize,
    read: Option<CudaEvent>,   // event of last read
    write: Option<CudaEvent>,  // event of last write
}
The purpose is automatic safety guarantees in multi-stream scenarios: if stream A wrote buffer X, then stream B wants to read buffer X, without synchronization it’s a data race. cudarc tries to manage this for you automatically.
How does it know you passed a buffer to a kernel? Look at the kernel launch parameter passing code (launch.rs#L100-L115):
unsafe impl<'a, 'b: 'a, T> PushKernelArg<&'b CudaSlice<T>> for LaunchArgs<'a> {
    fn arg(&mut self, arg: &'b CudaSlice<T>) -> &mut Self {
        if self.stream.context().is_managing_stream_synchronization() {
            if let Some(write) = arg.write.as_ref() {
                self.waits.push(write);    // "wait for last write to finish"
            }
            if let Some(read) = arg.read.as_ref() {
                self.records.push(read);   // "record this read"
            }
        }
        self.args.push((&arg.cu_device_ptr) as *const _ as _);
        self
    }
}
Every time you pass &CudaSlice to a kernel, the PushKernelArg trait gets called automatically — it doesn’t just stuff the raw pointer into the argument list, it also sneaks events into waits/records. At launch time, cudarc first executes cuStreamWaitEvent for all waits, then submits the kernel. All of this is completely transparent to the caller — you see no event operations in your code.
The problem: Graph capture records all operations on the stream — including these invisible cuStreamWaitEvent calls. And these events were recorded before capture (e.g., during the prefill phase), they don’t belong to the current capture’s dependency graph, violating stream capture’s isolation rules.
The fix: ctx.disable_event_tracking(). pegainfer runs on a single stream throughout, operations naturally execute in submission order, no event synchronization needed.
Obstacle 5: ~292 malloc/free Per Step
Even ignoring Graph, every operator is doing alloc output → compute → return. One decode step does ~292 cudaMallocAsync + cudaFreeAsync calls, which itself consumes time.
Summary of things to fix:
| Obstacle | Root Cause | What Needs to Be Done |
|---|---|---|
| Operator-internal malloc | fused_mlp alloc | Pre-allocate external buffer |
| Scalar parameter freezing | Graph recording freezes parameter values | Read from GPU buffer instead |
| RoPE view pointer changes | Different offset each step | Pass base pointer, kernel computes offset internally |
| cudarc event tracking | Automatically inserts cuStreamWaitEvent | Disable event tracking |
| Excessive malloc/free | Each operator allocates output | Unified pre-allocation |
Let’s solve them step by step.
Step 1: Eliminate Runtime Memory Allocation (Pre-allocation)
The iron rule of Graph capture: no cudaMalloc / cudaFree during capture. So the first step is to pre-allocate all intermediate buffers on the decode path at once, no more per-step alloc/free.
Design a DecodeBuffers struct containing all buffers needed for a single decode step:
pub struct DecodeBuffers {
    pub normed: DeviceVec,       // hidden_size = 2560
    pub q: DeviceVec,            // num_attention_heads * head_dim = 4096
    pub k: DeviceVec,            // num_key_value_heads * head_dim = 1024
    pub v: DeviceVec,            // 1024
    pub attn_out: DeviceVec,     // 4096
    pub attn_proj: DeviceVec,    // 2560
    pub mlp_act: DeviceVec,      // intermediate_size = 8960
    pub mlp_out: DeviceVec,      // 2560
    pub hidden: DeviceVec,       // 2560 (persists across layers)
    pub logits: DeviceVec,       // vocab_size = 151936
    pub decode_meta: CudaSlice<i32>, // 3 elements: [token_id, pos, seq_len]
}
About 320KB of GPU memory allocated once. After that, all intermediate results in every decode step write to these pre-allocated buffers, no more malloc.
Correspondingly, all operators get _into variants — output writes to caller-provided buffer instead of internal allocation:
rms_norm()       → rms_norm_into(out: &mut DeviceVec)
embedding()      → embedding_decode_into(decode_meta, out)
fused_attention() → fused_attention_decode_into(decode_meta, cos_base, sin_base, output)
fused_mlp()      → fused_mlp_into(act: &mut DeviceVec, out: &mut DeviceVec)
linear()         → gemv(y: &mut DeviceVec)
The original allocating versions are kept for the prefill path and tests.
Gain from this step alone:
Before:       TPOT = 14.63ms  (68.3 tok/s)
Pre-alloc:    TPOT = 13.58ms  (73.6 tok/s)
~7% faster. Looking at nsys’s CUDA API statistics, cuMemAllocAsync dropped from 19,934 calls to 10,877 (the remaining are from prefill and warmup paths). Steady-state decode gap also improved noticeably:
| Metric | Before | Pre-alloc |
|---|---|---|
| Single-step wall median (μs) | 13,495 | 12,636 |
| Single-step compute median (μs) | 11,919 | 11,943 |
| Single-step gap median (μs) | 1,538 | 687 |
| Gap percentage | 11.4% | 5.4% |
Same duckdb commands, just swap the sqlite file to reproduce.
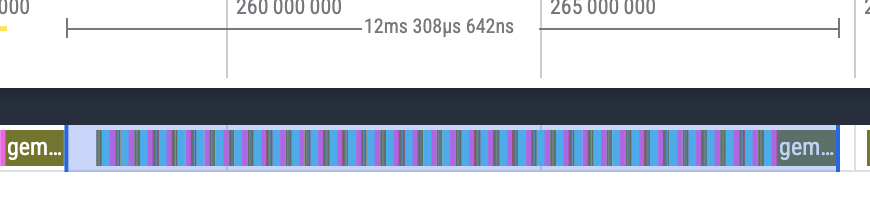
Kernel execution time is almost unchanged (same kernels), but gap median dropped from 1,538μs to 687μs. Saved ~850μs of malloc/free overhead.
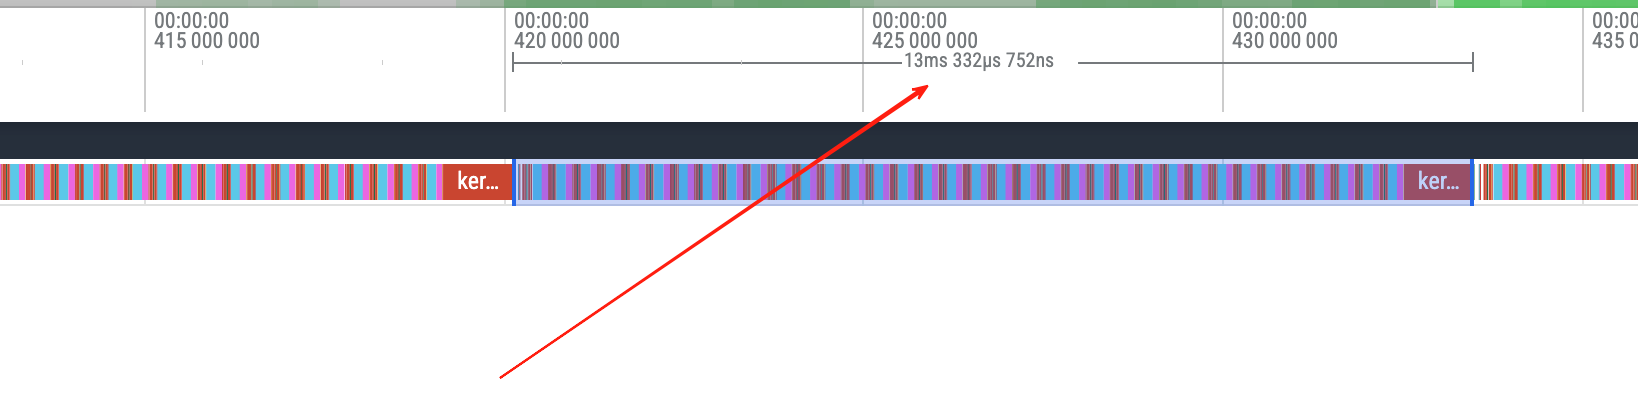
 Kernel gaps on the GPU timeline are getting smaller, more tightly packed.
TPOT dropped to about 12.6ms.
Step 2: Replace cuBLAS (Handwritten GEMV)
The decode phase is batch_size=1 single token forward. All linear layers are matrix × vector (GEMV), not GEMM. I replaced cuBLAS with handwritten shared memory reduction GEMV to have full control over every kernel’s implementation details, and also to make it easier for future operator optimization blog posts.
Step 3: DecodeMeta — Freeze the Pointer, Update the Data
Now all buffers are pre-allocated and cuBLAS is replaced, but there’s still one core problem: what about dynamic parameters that change every step?
Graph recording freezes the values of kernel parameters. If token_id=42 is passed to a kernel during recording, replay will always use 42.
The fix: turn scalar parameters into pointer parameters. Allocate a small buffer at a fixed address on the GPU, and the kernel reads values through the pointer. Each step, outside the graph, use memcpy_htod to update the buffer contents. The pointer (address) doesn’t change, but the data it points to does.
Concrete implementation:
1. Define decode_meta — 3 i32s on the GPU
decode_meta[0] = token_id      // current token
decode_meta[1] = current_pos   // KV cache write position
decode_meta[2] = seq_len       // attention window length
This buffer is pre-allocated in DecodeBuffers (listed above), address never changes.
2. Update contents outside the graph each step
// On the same stream, before graph.launch()
self.ctx.stream.memcpy_htod(
    &[token_id as i32, pos as i32, seq_len as i32],
    &mut bufs.decode_meta,
)?;
12 bytes of H2D memcpy. Because it’s on the same stream and before graph.launch(), CUDA’s stream ordering guarantees the memcpy completes before kernels start executing.
3. Kernel side: read dynamic values from pointer
Original embedding kernel (scalar parameters, not Graph-compatible):
__global__ void embedding_kernel(
    const __nv_bfloat16 *embed, int token_id,
    __nv_bfloat16 *out, int hidden_size) {
  int idx = blockIdx.x * blockDim.x + threadIdx.x;
  if (idx < hidden_size)
    out[idx] = embed[token_id * hidden_size + idx];
}
New version (reads token_id from decode_meta, Graph-safe):
__global__ void embedding_meta_kernel(
    const __nv_bfloat16 *embed, const int *decode_meta,
    __nv_bfloat16 *out, int hidden_size) {
  int idx = blockIdx.x * blockDim.x + threadIdx.x;
  if (idx < hidden_size) {
    int token_id = decode_meta[0];  // read from GPU memory at runtime
    out[idx] = embed[token_id * hidden_size + idx];
  }
}
The difference is just one line: token_id goes from a kernel parameter to reading from decode_meta[0]. What Graph recording freezes is the pointer address of decode_meta (doesn’t change), not the value it points to (updated every step).
The same pattern is used in the fused attention kernel:
__global__ void fused_gqa_attention_decode_kernel(
    ...,
    const int *decode_meta,         // fixed pointer
    const __nv_bfloat16 *cos_cache_base,  // RoPE base pointer
    const __nv_bfloat16 *sin_cache_base,
    ...) {
  int current_pos = decode_meta[1];   // different each step
  int seq_len = decode_meta[2];       // different each step

  // RoPE: compute from base pointer + offset
  const __nv_bfloat16 *cos_cache = cos_cache_base + current_pos * head_dim;
  const __nv_bfloat16 *sin_cache = sin_cache_base + current_pos * head_dim;
  ...
}
RoPE cache uses the same idea: instead of passing a per-position slice (pointer changes each step), pass the entire cache’s base pointer (doesn’t change), and the kernel internally computes the offset with current_pos * head_dim.
Step 4: Capture / Replay Lifecycle
All obstacles cleared, ready to record.
struct CudaGraphState {
    graph: Option<CudaGraph>,
}
None means not yet recorded, Some(graph) means recorded and replayable.
Complete decode flow:
fn decode_one_token(&self, token_id: u32, kv_cache: &mut KVCache,
                    bufs: &mut DecodeBuffers, graph_state: &mut CudaGraphState)
-> Result<()> {
    let pos = kv_cache.len();
    let seq_len = pos + 1;

    // ① Update dynamic parameters outside the graph
    self.ctx.stream.memcpy_htod(
        &[token_id as i32, pos as i32, seq_len as i32],
        &mut bufs.decode_meta,
    )?;

    match &graph_state.graph {
        Some(graph) => {
            // ③ Subsequent steps: just replay
            graph.launch()?;
        }
        None => {
            // ② First step: record + execute
            self.ctx.stream.begin_capture(CU_STREAM_CAPTURE_MODE_THREAD_LOCAL)?;
            self.decode_kernels(kv_cache, bufs)?;
            graph_state.graph = self.ctx.stream
                .end_capture(CUDA_GRAPH_INSTANTIATE_FLAG_AUTO_FREE_ON_LAUNCH)?;
            // capture only records, doesn't execute — need to launch once for actual computation
            graph_state.graph.as_ref().unwrap().launch()?;
        }
    }

    kv_cache.increment_seq_len();
    Ok(())
}
Three phases:
-
Prefill: batch forward, takes the cuBLAS GEMM path, no recording. Produces the first token.
-
First decode (
graph = None):begin_capture→decode_kernels()(records all ~397 kernels) →end_capture+ instantiate →graph.launch(). Note that during capture, kernels are only recorded, not executed — you must explicitly launch once for actual computation. -
Subsequent decode (
graph = Some):memcpy_htodupdatesdecode_meta→graph.launch()— a single driver call replays all kernels.
decode_kernels() is the pure kernel sequence being recorded:
fn decode_kernels(&self, kv_cache: &mut KVCache, bufs: &mut DecodeBuffers) -> Result<()> {
    ops::embedding_decode_into(&self.ctx, &self.embed_tokens, &bufs.decode_meta, &mut bufs.hidden)?;

    for (layer_idx, layer) in self.layers.iter().enumerate() {
        self.decode_layer(layer_idx, layer, kv_cache, bufs)?;
    }

    ops::rms_norm_into(&self.ctx, &bufs.hidden, &self.norm, self.config.rms_norm_eps, &mut bufs.normed)?;
    ops::gemv(&self.ctx, &self.embed_tokens, &bufs.normed, &mut bufs.logits)?;
    Ok(())
}
Zero CPU-GPU synchronization, zero memory allocation — this is the prerequisite for capture.
A few implementation details:
- cudarc event tracking: disabled with
ctx.disable_event_tracking(). pegainfer uses a single stream throughout, no cross-stream synchronization tracking needed. - Non-default stream: the null stream doesn’t support capture, need to use
ctx.new_stream()to create an independent stream. - Graph reuse across requests: all buffer (weights, KV cache, DecodeBuffers) GPU pointers never change throughout their lifetime, so the graph doesn’t need re-recording. New requests only need to reset the KV cache’s logical length; physical addresses don’t change.
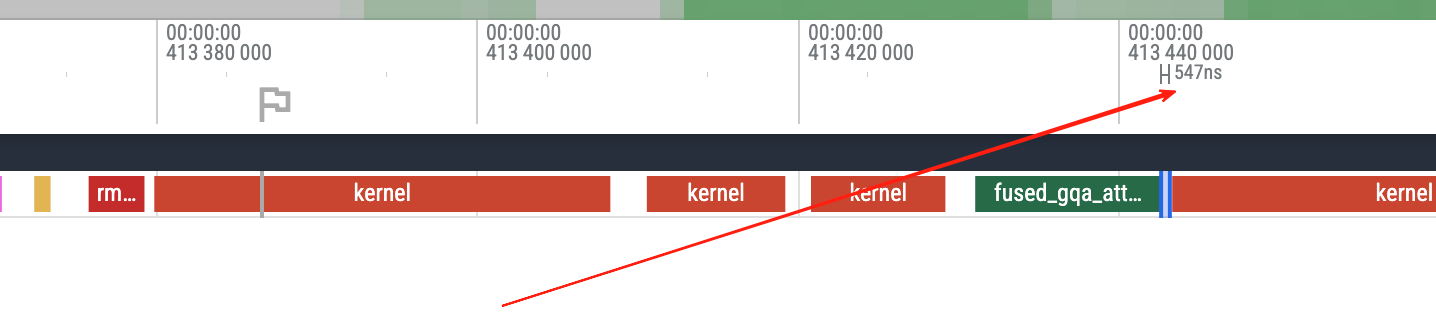
Let’s look at the profile trace under Graph:
Wow, completely filled! No gaps.
Now look at the TPOT change:
 Further dropped to 12.4ms. There still seems to be a ~400us gap between each step, maybe the Rust layer isn’t scheduling promptly. We’ll investigate this further in the performance analysis blog.
After: Performance Comparison
Median of 24 steady-state decode steps (same prompt “Tell me a story”, nsys --cuda-graph-trace=node):
| Metric | Before | Pre-alloc | CUDA Graph |
|---|---|---|---|
| TPOT (ms) | 14.63 | 13.58 | 12.29 |
| compute median (μs) | 11,919 | 11,943 | 11,951 |
| gap median (μs) | 1,538 | 687 | 490 |
| gap percentage | 11.4% | 5.4% | 3.9% |
The three stages correspond to commits
f8b9305,b65f397,0f684f6respectively. CUDA Graph’s compute/gap data comes from--cuda-graph-trace=nodemode (slight profiling overhead), TPOT comes from bench_decode measurements. The duckdb SQL above can be reproduced by swapping sqlite files.
The compute columns are almost identical across all three (~11.9ms) — the kernels didn’t change, only the gaps did. Pre-alloc cut away malloc/free overhead (1,538→687μs), Graph further cut away launch overhead (687→490μs).
Qwen3-4B reads all weights ~7.67 GB per decode step. TPOT of 12.29ms corresponds to effective bandwidth ~624 GB/s. The RTX 5070 Ti’s theoretical peak is 896 GB/s, so utilization is about 70%. The remaining 30% bandwidth gap is in the kernels themselves (the current kernels were all written by Opus 4.6 in high mode, without careful tuning — basically all naive versions).
In the next post, we’ll enter kernel optimization, i.e., operator optimization — how to write a good operator, how to profile. This seems to be the deep end of CUDA: how to make an LLM write sufficiently good operators while ensuring correctness, using the right tools and references.